An electrocardiogram, ECG or EKG is a display method for the electrical activities of the heart. While reading a cardiogram is usually done by cardiologists, their assistants and nurses, you can also benefit by getting to know what the various ECG graphs and figures stand for. However, remember that this does not make you a cardiologist. You will still need to consult the professionals for proper interpretation and diagnosis of your heart’s rhythms.
Understanding and interpreting an electrocardiogram can only be properly done by trained personnel. Moreover, an ECG is not used to make a diagnosis of a heart condition on its own. Physical examination and a patient’s medical history as well as patient interview are the important basis for diagnosis of heart ailments.
Step 1
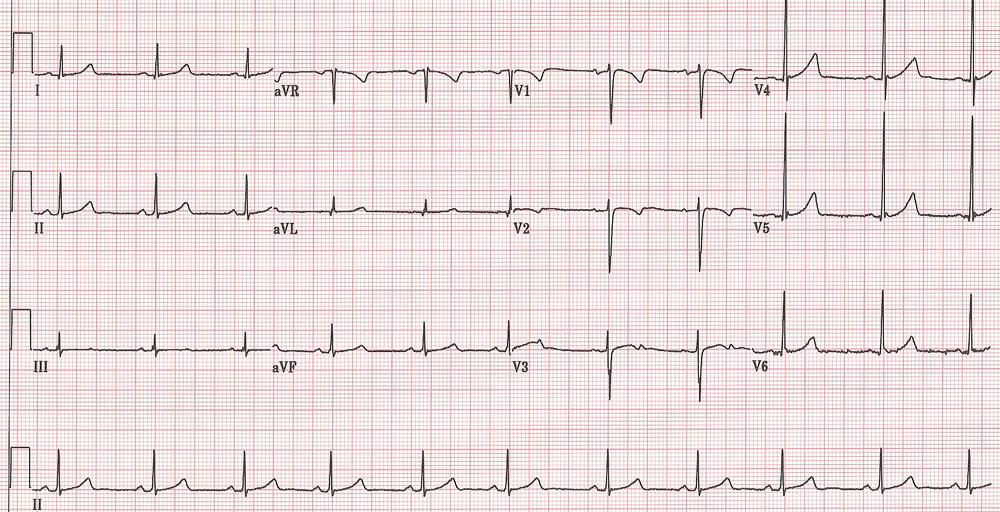
A heart monitor usually has 12 leads which pick up electrical impulses originating from the heart and transfers them to the monitor. To read the ECG, you start by picking the leads. The waveforms of the different leads are different as they relate to different perspectives of the heart. Leads number V1 to V4 have a frontal perspective; leads coded V5, V6 and aVL have a side perspective and leads coded II, III, aVF have a back and lower perspective of the heart.
Step 2
Observe the grid in the monitor. The horizontal lines represent time, with each of the little boxes 0.04 second, while each larger box represents 0.2 second and every five larger boxes represents one second.
The vertical lines show the voltage; one small box is 0.1mV. For most heart monitors, two larger boxes representing 1.0mV are marked with a darker line.
Step 3
Now that you have learnt the basics of how to read a heart monitor, try to locate and mark the P-wave, usually most outstanding on lead I. P-waves are normally small bumps that appear before the rest of the complex of waves and figures. It may be shallow, appear several times in a row or be hard to detect due to the heart’s rhythm.
Step 4
Locate and mark the main wave form (QRS complex). Q-wave is rare and when present, usually dips below the baseline at the start of the main waves complex. These are followed by the R-wave which is normally tall and spiky. The S-wave is next. It normally dips below the baseline in a long and sharp spike.
Step 5
Next, look for and mark the T-wave. This is normally a small bump following the main wave complex. In some patients, the T-wave is hard to locate as it may be flat, inverted or easily confused with P-wave.
Step 1
Normal intervals between a P-wave and an R-wave ranges between 0.12 and 2.0 seconds. A longer interval could be the sign of conduction abnormalities, while the appearance of several P-waves or seemingly fluttering P-waves might signify arterial fibrillation or similar conditions.
Step 2
Locate any Q-wave formations. Their presence is an indication of heart damage or a past heart attack. Ventricles’ discharge and contraction are represented within QRS complex. You can determine the heart rate by counting the big boxes from one R-wave to the next and dividing 300 by this number.
Counting the R-waves in a 6-second strip and multiplying this number by 10 can help determine the presence of irregular heartbeats. Results higher than 100 bpm indicate tachycardia, while those below 60 bpm indicate bradycardia. When QRS wave complexes appear close together and P-waves are missing, the life-threatening ventricular fibrillation is indicated.
Step 3
ST segment lies between S-wave and T-wave. Elevations here are indicative of a heart attack or myocardial infarction.
An electrocardiogram measures many aspects of the heart’s activities as you would find out by learning how to read a heart monitor. For this reason, an abnormal ECG’s result can signify many things which include:
Treatment following an abnormal EKG depends on the cause of the abnormality.